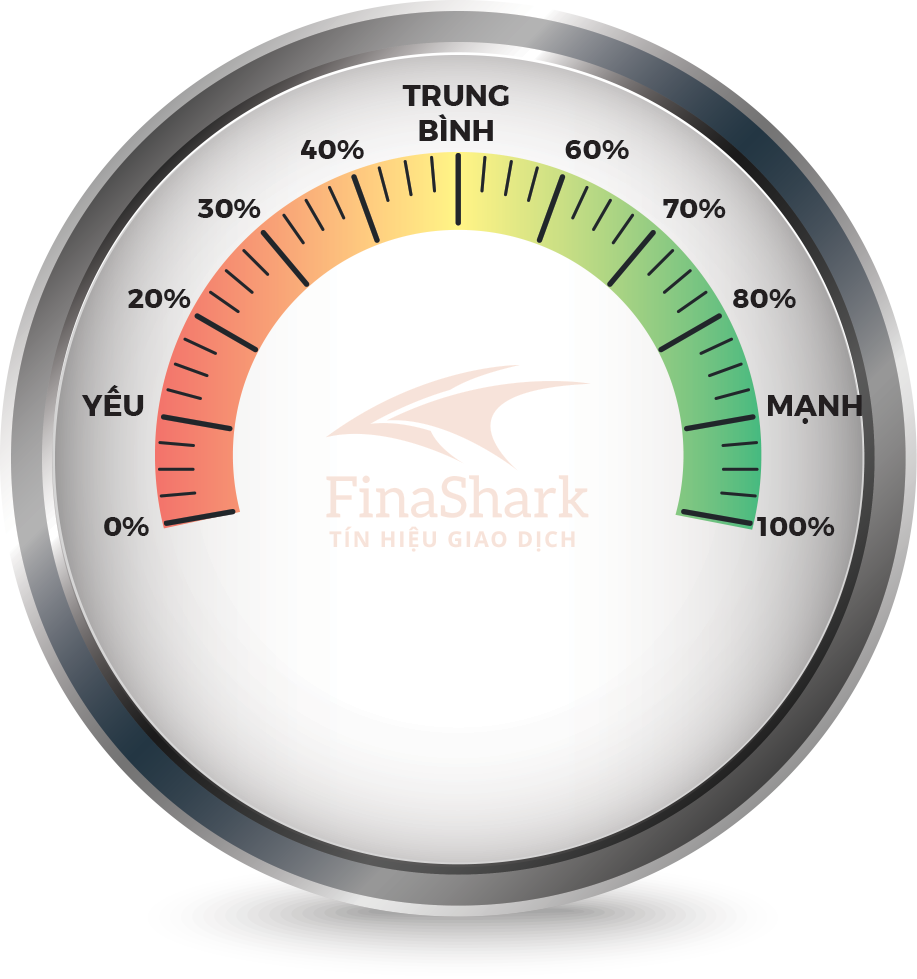
Financial Asset Compass
Update: 26/04/2024 Realtime

* Indicates how capital flows into each financial asset.
Financial Asset Map
Enter ticker here
Or enter of stock name


Market conditions
Financial Asset Compass
Update: 26/04/2024 Realtime
* Indicates how capital flows into each financial asset.
Financial Asset Map
Ticker
Name
Update time
Last price:
High:
Low:
Change:
Volume:
10-day Average Volume:
%
Short-term Investment Strategy
Trend Following Investment Strategy
Market maker mindset
Smart money data
* Analyses the commitment of smart money flows into the stock in relation to the general market
Smart money mindset
Money behavior
* Money indicator: Smart money flow factors.
Prob. of reversal:


Probability
Pressure
Warning Level
* Reversal indicator: Shows the possibility of the market maker reversing the trend.
Risk management
%

Volatility
HighMediumLow%
Std. deviation
HighMediumLow%
Risk
HighMediumLow* Risk indicator: The level of risk when holding assets.
Fundamental analysis
Investment Stages
Should be viewed separately
from equities and index futures.
Investment comparison:
Technical analysis chart

